This Entergy substation SW of Mayflower received a direct hit from yesterday’s tornado. Click the image to open an interactive map for this point as well as other areas along the damage path.
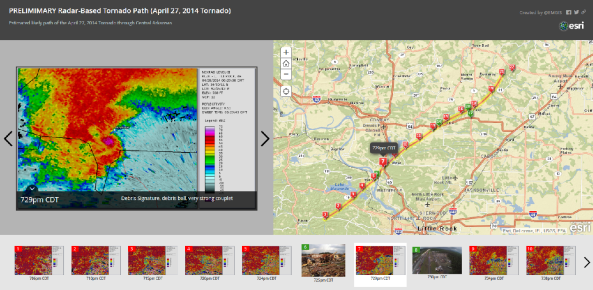
It’s April again and that unfortunately means it’s tornado season. Clicking the image to your right will take you to an interactive story map showing the tornado path for this storm, with links to videos, pictures and other supporting information. The story shows a step by step view over a 60 minute period during the life of this tornado.
This storm rotation path is based on NWS Weather Radar observations. Points were added to depict the center of rotation at roughly five minute intervals as the radar updated. Those points are then connected to depict an approximate rotation path, which is then buffered on each side to depict a 1/4 mile, 1/2 mile and 1 mile wide area. The tornado width has not yet been determined by NWS Little Rock, however these ranges help to depict likely impact areas, with the most likely impact area being the 1/4 mile wide corridor (red area), followed by the orange area (1/2 mile wide corridor) and finally the 1 mile wide corridor (yellow area).
Additionally, the damage photos and videos were added to the story map AFTER the damage path was created. This means that as videos and pictures are reported to/by local media, social media, emergency managers, etc., the location of the photos can be compared against the preliminary estimated damage path in order to verify the accuracy of the information.
The preliminary impact corridor is essentially serving to identify the hazard zone. On top of that map, information on community facilities, demographics, etc can be overlaid, thus creating an realtime operational impact analysis or risk assessment. That in turn can be used to help refine the response to the hazard so the community can respond and then recover as fast as possible.
When you don’t know the impact zone of any natural disaster, it’s nearly impossible to get your arms around the situation and make sure that the appropriate resources are being called upon to assist in the response. However when the impact zone is clearly identified, it can facilitate improved collaboration and effectiveness of the response – from individual citizens and neighbors, to community groups, charities and finally local, state and national officials.
If you find this resource helpful, please pass it on to others. Thanks.
Interactive ESRI Story Maps view of the April 27, 2014 tornado that impacted Mayflower and Vilonia, AR.
Earlier this evening, several supercells erupted in Central Oklahoma, producing several strong to violent tornadoes. These tornadoes impacted communities such as Edmond, Carney, Norman, Bethel Acres and Shawnee. Much of the attention now including prayers have been focused on those impacted in a mobile home park directly in the path of the tornado where at least one fatality has occurred.
The following link goes to an interactive map showing the approximate paths of the three most significant tornadoes that impacted Central Oklahoma. The map has a bookmark feature where you can view the Edmond, Carney and Norman to Shawnee tornadoes. Similar tornado path maps have been very helpful and highly accurate for other significant tornadoes events over the past several years.
Click on the graphic to launch an interactive map. The map contains bookmarks for the 3 tornadoes as well as an address lookup feature.
This information is unofficial information, but is based upon NWS Radar scans and uses the National Climate Data Center Weather/Climate Toolkit (NCDC WCT) and ESRI’s ArcGIS Online. For official storm survey results, please follow the National Weather Service in Norman, Oklahoma (@NWSNorman). In the coming days, the National Weather Service will be performing storm damage surveys. When more information is made available, I’ll be linking to those products.
A Blizzard Warning and Winter Storm Warning has been issued parts of the Southern and Central Plains, the second such blizzard in a week for some residents. However a concept in disaster preparedness can be readily displayed with the forecast for this event. Currently, the National Weather Service is forecasting a foot as the upper limit to the snowfall values in Kansas and 15″ as the upper limit to snowfall values in extreme Northeastern part of the Texas Panhandle. But the highest snowfall totals for this storm could be much much higher….
Recently, the NOAA Hydrometeorological Prediction Center (HPC) began issuing probabilistic snowfall graphics (shown below) that show snowfall forecasts where snowfall values are exceeded 90%, 75%, 50%, 25% and 10% of the time.
HPC 50th Percentile Snow Forecast (Click for larger image)
HPC 90th Percentile Snow Forecast (Click for larger image)
Essentially a 50th percentile snow forecast is the forecast that 50% of the time the amounts will be higher and 50% of the time, the amounts will be lower. For planning purposes, this is the likely amount forecasted if you’re going to play the middle of the road.
However the 90th percentile forecast is quite different. It shows the amounts that will be exceeded only 10% of the time. While many people want to forecast snow amounts accurately, the 10% probability event is a great resource to “Plan for the worst” and the 50% probability event is “hoping for the best”.
The wild card in events like this is thunder snow. Essentially, areas where thunder snow occurs can receive locally higher snowfall amounts. The snow probabilities point to this potentiality, although the bands of intense snowfall will not cover the entire area. Depending on where the most intense bands set up, it will dramatically impact the amounts of snow received in those areas. This again points to the importance of the 10% exceedance threshold. Most people will receive snow amounts closer to the 50th percentile amount, but there will be pockets where people receive substantially higher amounts.
Comparison between NWS forecast (left) and HPC 90th percentile / 10% exceedance forecast (right) Current as of 0800CT on 2/24/2013
You may be saying right now, “that’s great but I hate math and hate probabilities”. Communicating potential risk, especially in low probability, high impact events is critical for anticipating the worst and taking protective action while hoping for the best. If there was a 10% chance of an intruder in your house, going after you and your family, would you take protective action? If there was a 1 in 10 chance that you could lose your job, would you start developing a backup plan?
We’ll see how this specific event unfolds, but the current forecast (left in map above) isn’t even at the levels depicted in the 50th percentile event (likely underestimating snow amounts). Between that and the incredible disparity between the forecast and 10% potential snowfall amounts, this is a classic example where people can and likely will be caught surprised by the event.
Damage to Music Building at University of Southern Mississippi (WDAM)
UPDATE: 536pm CT – The National Weather Service office in Mobile, AL has released the preliminary storm survey results confirming two tornado tracks in their forecast area produced by the same storm that impacted Hattiesburg, MS. The storm survey team found EF-1 intensity damage in Wayne County with a tornado tracking nearly 17 miles in a discontinuous path. The tornado first touched down near the community of Clara and then tracked to Denham before lifting.
Additionally, EF-0 damage was found in Northwest Perry County – an extension of the track of the same tornado that moved through Hattiesburg and Petal, MS.
Additional details will be forthcoming over the next few days after survey teams complete their data, especially looking on Tuesday in the Washington and Clarke County areas in Southwest Alabama.
UPDATE: 505pm CT – The National Weather Service in Jackson, MS has just upgraded the intensity from the Hattiesburg / Oak Grove tornado that impacted Lamar and Forrest Counties yesterday. The tornado was preliminarily rated EF-3, but that rating has since been upgraded as damage consistent with 170mph winds was observed in the area of Oak Grove High School. This violent tornado was only the second violent tornado (EF-4 or EF-5) recorded in Lamar or Forrest Counties since record keeping beginning, the other tornado being the April 24, 1908 Purvis tornado which was on the ground for 155 miles and impacted a wide ares from Louisiana into Mississippi (Source: NWS Jackson MS).
The NWS storm survey teams have also preliminarily confirmed EF-2 tornado damage in Southwest Marion County – a separate track from the tornado that hit Hattiesburg. This confirms the suspicions in the original post that the storm “cycled” and produced separate tornadoes – as indicated by radar signatures.
Storm survey teams preliminarily confirm EF-2 tornado damage in SW Marion County. Seperate tornado track from the one that hit Hattiesburg.
“We were blessed”. That is what the Mayor of Hattiesburg, Mississippi said repeatedly when interviews on CNN after a strong tornado tore through the city on an otherwise calm Sunday afternoon in February. As he stated repeatedly, even though the University of Southern Mississippi, several high schools, and the American Red Cross center were all directly hit by this storm, there were only limited injuries and not fatalities. The fact that we’re reporting on damage to buildings, NOT fatalities is key in this story, and with storms like these, timing is everything.
First off, with students already on a long weekend break with Mardi Gras coming up, so the tornado occurring on the middle day in a four-day weekend meaning that the campus was relatively quiet. Throw in the fact that the campus is a short two-hour drive from New Orleans, many students were likely out of town for one reason or another. Additionally, the Elam Arms residence hall was hit by the tornado, blowing out windows to the multi-story residence hall… But the residence hall has not been used for some time, and according to a July 15, 2011 story from WDAM in Hattiesburg, the university was hoping to tear down the dormitory because “it’s considered to be in a prime location, for a developer to put in a business…. An excellent site for a hotel.”
According the University website, several structures in the southern portion of the campus were damaged including Jazz Station, the Mannoni Performing Arts Center, Ogletree Alumni House, and Elam Arms.
Mississippi is no stranger to strong tornadoes as we have seen in years past in places like Yazoo City. This storm was similar to previous supercells producing long-lived tornadoes. The supercell tracked from Southern Walthall County in Southern Mississippi through the counties of Marion, Lamar, Forrest, Perry, Jones and Wayne. The same storm was also responsible for damage near Millry and Coffeeville in Washington and Clarke Counties in Southwest Alabama.
Based on an initial review of the radar data from this storm, the same supercell appeared to have cycled at several points along this 3.5 hour, nearly 170 mile long path. The National Weather Service Offices in New Orleans, Jackson and Mobile will likely be performing damage assessments over the next several days. It will be interesting to see where the damage paths are confirmed to have started/stopped, but the most likely points for breaks in the paths appear to be located near the following locations in that path:
Near the Marion / Lamar County, MS line – slight jog in the storm path to the right
Southwest Wayne County, MS – Just west of Camp Eight Road in the De Soto National Forest
Clarke County, AL – The storm appears to have crossed US-84 roughly 5 miles east of Coffeeville, AL
Radar-based rotation path for the Hattiesburg, MS supercell. Note the path changes and possible locations for breaks in the path (cycling supercell).
In all, it is pretty likely that there were multiple tornadoes along this path. The worst of the damage appears to be EF-2 to EF-3 in intensity, with the Hattiesburg tornado causing damage consistent with a tornado of at least EF-3 strength. EF2 and greater tornadoes are rated as strong, so regardless of the damage, it is clear to say that the area was impacted by a strong tornado.
Tornadoes are rated by the damage they produce.
EF0…WEAK……65 TO 85 MPH
EF1…WEAK……86 TO 110 MPH
EF2…STRONG….111 TO 135 MPH
EF3…STRONG….136 TO 165 MPH
EF4…VIOLENT…166 TO 200 MPH
EF5…VIOLENT…>200 MPH
On a related topic the National Weather Service in Mobile tweeted the following graphic. Incredibly their 30 minute forecast for this supercell was HIGHLY accurate both temporally and spatially. The storm passed within a mile of Robinson’s Junction at 0027 UTC – right in line w/ the forecast graphic below. The use of Social Media in this case to not only get out the tornado warnings, but to EMPHASIZE areas that are at greater risk represents a MAJOR opportunity for the National Weather Service to enhance their communication with customers.
NWS Mobile – Projected Path of Tornadic Supercell – VERY ACCURATE 30 MIN FORECAST – Storm passed w/in a mile of Robinson’s Junction at 0027 UTC.
Genius!! Pure genius! This is a major challenge with disaster preparedness today, and learning lessons from history and previous disasters are essential to minimizing impacts from future disasters. Case and point NYC… With Hurricane Sandy, the storm surge was referenced as being a record surge.. even higher than the hurricane that occurred in 1821. This still begs the question – “what if the hurricane of 1821 happened again today… what would the impact be?” Additionally, as stated in http://stevengoddard.wordpress.com/2012/11/15/1821-hurricane-struck-new-york-at-low-tide/, the 1821 storm actually struck at LOW tide.. meaning the Category 3 storm then could have produced a tide level even higher than Sandy had it struck 12 hours earlier or later. Again.. this means for preparedness… “THIS COULD HAPPEN…” Again, great advances in technology, now we just have to put it together to answer the core questions… what if it happened again today, and how could we be more prepared…
Link: NHC Views on Storm Surge Scales Released September 10, 2010
There are scales for tornadoes, hurricanes, earthquakes, and other natural hazards. In the aftermath of Hurricane Isaac, there were numerous calls for the National Hurricane Center to add back in a storm surge scale into the hurricane scale. In an August 31st article from the New York Times, “Climatologists like Kerry Emanuel of the Massachusetts Institute of Technology have said that any classification should include both wind speed and surge. Otherwise, he argues, coastal residents can be easily misled.”
NWS Louisville Statement on the Challenges in Damage Assessment for the Henryville, IN Tornado.
UPDATE: MARCH 6 – The National Weather Service in Louisville has published their initial findings including descriptions of the areas impacted. That information is available at: NWS Louisville Damage Surveys – March 2, 2012.
The past two days have been full of media reports, tweets and information being shared on the tornado outbreak that occurred on March 2nd, 2012 affecting towns like Henryville, IN. As you can see from the statement below from the NWS Louisville Forecast Office, there were two supercell storms that impacted the area, with the first one producing the tornado that most people are talking about. There was in fact a second storm behind the first one that also produced tornadoes and tornadic damage. To make things more complicated for damage assessment teams, the paths essentially paralleled one another, and even crossed in places, making it difficult to attribute the damage to one storm versus the other.
I’ve put together the following the following map based on the NWS Radar information from the March 2nd tornado outbreak. The map shows the paths of the two storms and paint the clear challenge that the NWS professionals have in identifying and differentiating between the two damage paths. Continue reading →
When we think of mapping using GIS for disasters and emergencies, we think of tornadoes, floods, hurricanes, earthquakes and the like. When we think of education, we often think of the same old off-the-shelf material from a book that we just take and share thinking we’re teaching. However in both cases, we miss out on one of the joys of education. Applying knowledge from one discipline or area to other areas of life…
Many of my followers on Twitter (Follow @emgis on Twitter) and this blog know of the CDC’s preparedness campaign from earlier this year on Zombie Preparedness – “Preparedness 101: Zombie Apocalypse“. However most people who are familiar with the preparedness campaign are from the Social Media for Emergency Management (#SMEM hashtag on Twitter) community. Most of them are not GIS people and haven’t seen how Geographic Information Systems (#GIS hashtag on Twitter) can improve our preparedness for Zombies (and for other disasters…) Additionally, the Connected Principals Chat community (#cpchat hashtag on Twitter) could benefit from this post because it provides another way to engage students and parents on a number of levels. You may not use zombies for important information to share, but please take a look at these examples and think of how you can apply this to your discipline and the content that you find important to share with others.
Today’s post is part 3 of a series on Operational Context (View the other posts in the series here). In this third series, we will be looking at the same questions that we’ve been looking at throughout this series. Today’s post will be looking at rainfall amounts, and is tied very closely to the last post on drought. Essentially, many of the same datasets for extreme rainfall and drought can be used with one another, it’s just that the rainfall data is looking for an absence of rainfall when you’re looking at drought. This will also tie into the next post on Operational Context – Flooding which will be looking at the extreme rainfall events and their impact as the water runs off. So, let’s go ahead and look at today’s theme – extreme rainfall.
There are several ways to measure or estimate rainfall. Most people know about rain gages and using them to measure rainfall (see examples in post on Innovative Ways to Teach the 3 M’s – Math, Maps, Measurement). Rain gages are great for measuring what fell in a specific location, but there will always be gaps in coverage. Rainfall can be enhanced or reduced by terrain or other geographic features, so point data by itself isn’t enough. There are rain gages at major airports, and there are companies with portable weather stations where rainfall can be measured. Additionally, did you know that you can participate in rainfall measurement directly by participating in CoCoRaHS (stands for Community Collaborative Rain, Hail, & Snow Network)? Continue reading →
When it comes to earthquakes and being aware / ready for major earthquakes, you might think of the San Andreas Fault, or places like Japan, Chile, China, Mexico or Indonesia.
However in the past year, there have been two extremely significant earthquakes in the United States that were “outliers” from previous events. Both of these were felt over large areas and measured above 5.5 on the Richter Scale.